🚀 Shipped: Solar Energy Analysis Dashboard
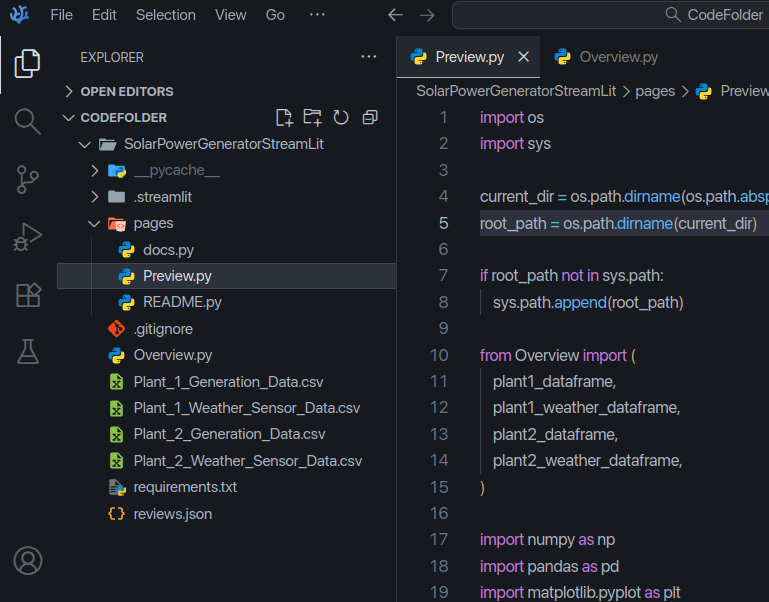
I built a Streamlit app that analyzes solar power generation data from two plants, comparing weather patterns and energy output.
🔗 GitHub: github.com/hemanta-kandel/Solar-Energy-Analysis-Project
🌐 Live App: solar-energy-analysis-project.streamlit.app
I used:
- Python
- Streamlit for the dashboard
- Pandas & Matplotlib for data analysis
This project is part of my journey to build AI and energy solutions.
#C0A4Z447Z5J #arcade #streamlit #datascience #solar
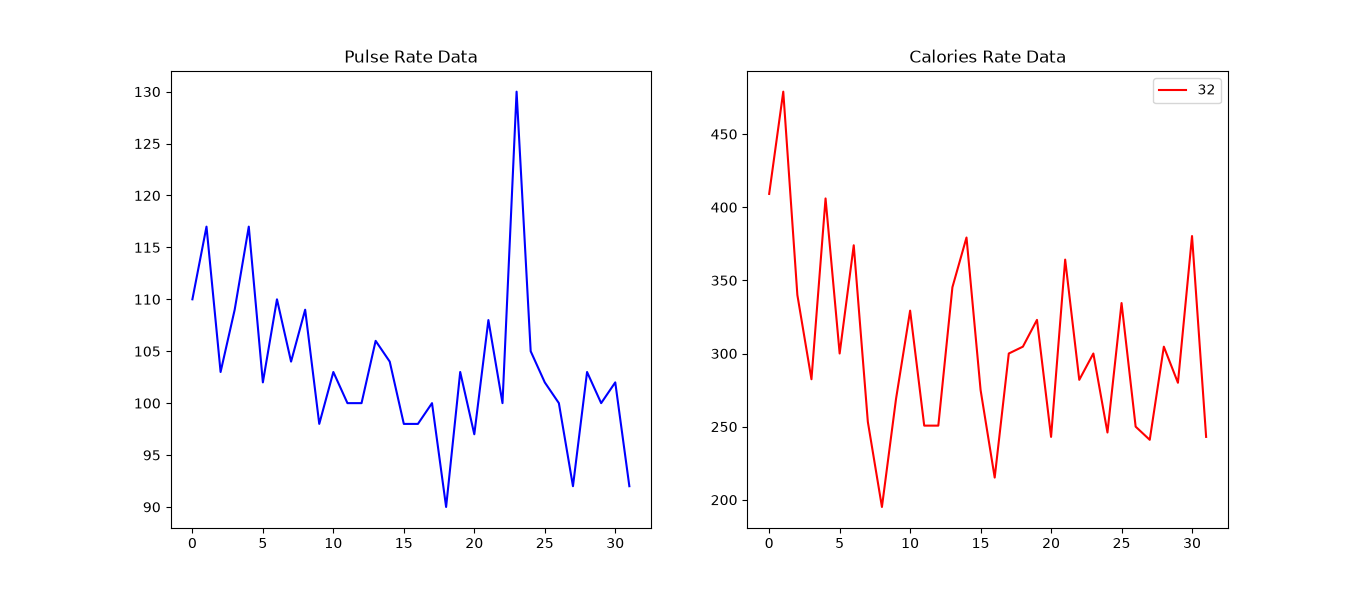
I have created a project called "Fitness-Project" that is available to see at the github : github.com/hemanta-kandel/Fitness-Project. The image sample of the project is given called 'Output-pie.png'. Description :- This project uses a machine learning and data analysis libraries to fullfill the requirements, Numpy(for numerical work), pandas(for cleaning of data), matplotlib(for visualization), scikit-learn(RandomForestRegressor) etc are the libraries inside the python used. This project is designed to easily change for personal fitness tracking.